Many times, ongoing reports are a requirement for organizations that receive grant funding. If this is your case, you’re in luck: Most learning management systems (LMSs) make it easy to put training metrics together for progress reports in a few simple clicks. And depending on your setup, your LMS may even gather the data automatically — so all you’ll need to do is organize and present it.
These training metrics also prove valuable when it comes to tracking overall progress and the success of your program.
As an agency, leveraging this data can also save you time and resources so your team can focus on your main goals. The trick is to be systematic about it and know how to interpret the types of data that your learning system provides. As well as making sure that monitoring progress and behavior is part of your performance and progress reports.
To help you get started with your reporting, we’ve compiled 10 training metrics essential for your requirements. Furthermore, they’ll allow you to assess how well your online training program is going on a day-to-day basis.
10 Training Metrics Every Remote Learning Program Needs to Track
- Enrollment rates
- Logged in vs. completions
- Last login
- Learner progress
- Learner participation and engagement
- Total time spent in lessons
- Online assessments
- Knowledge-gain
- Certificates Earned
- Satisfaction
Enrollment Rates
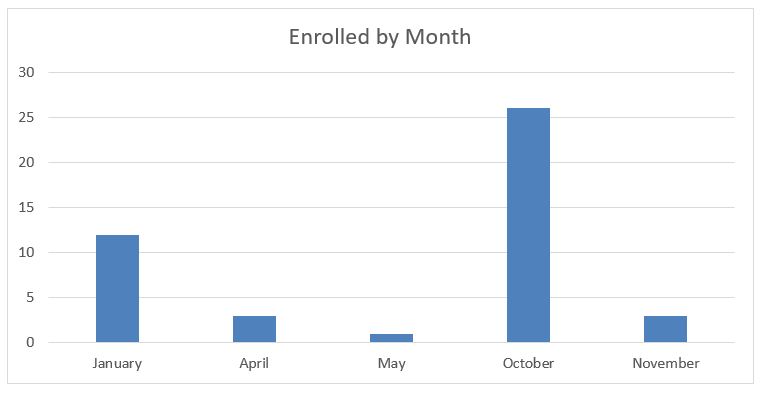
Your program may be tightly controlled, and you know exactly who is participating and when. On the flip side, open-enrollment programs allow for less control, so a report that shows how many people enrolled will help you understand interest.
In the above example, you can see at a glance the vast difference between enrollment from month to month. May had very few compared to October. Which you may be expecting, for example, if you did a big promotional push in October. But if you didn’t, this report can help you look elsewhere for external influences that are affecting your registration.
Logged-in vs. Completions
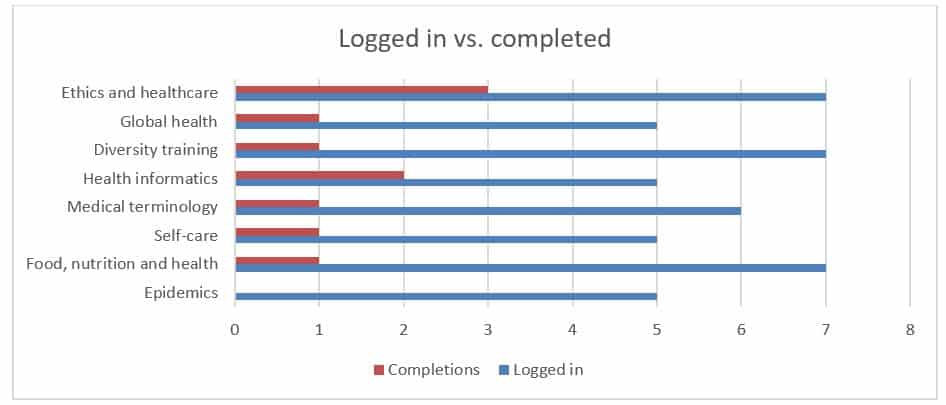
It’s easy to focus on the successful completion rate in a course (see below section on certificates). But comparing that information to the number of logins, you’ll find some interesting trends. Contrasting numbers in these training metrics point to a gap somewhere in your program: If the numbers are even — good job! You’ve got great engagement from beginning to end. If not, you can start to see deeper.
In this example above of the diversity training course, seven times the number of people logged in vs. completed. This tells you that many people started the course but dropped out before finishing. It’s a good idea to measure this so you can identify any barriers to completion. Sometimes this is poor alignment with participants (i.e., the wrong people are signing up for the course).
Last Login
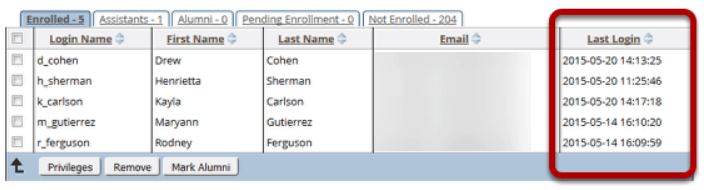
Looking at the last login date on a course will help you zero in on people who have disappeared. This is crucial for follow-up. A good practice is to check this at least once per week for ongoing courses.
Learner Progress
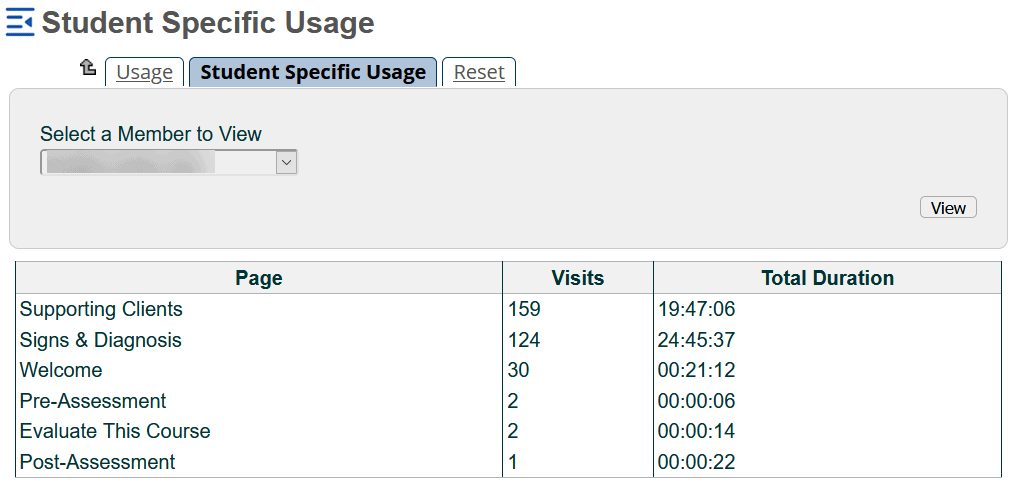
Checking learner progress reveals how far along the course they are. With this training metric, you can see which modules they’ve completed and if they’re moving at a rate you’re expecting. Looking at student-specific usage lets you monitor each person’s performance so you can step in if you see anything unusual. This sort of report, when compared against others, can help you identify high performers vs. low performers.
Learner Participation and Engagement
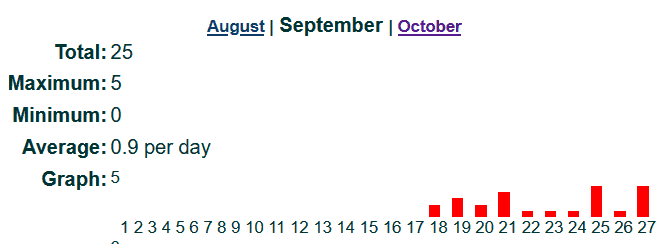
Checking daily statistics to see who’s logged into the course can be helpful to show the busiest and slowest days. The above chart shows that in September, traffic spiked. It also reveals that Mondays, Fridays, and Sundays are some of the highest-trafficked. When those bars are low and are consistently dropping off, you might need to do some outreach.
Total Time Spent in Lessons
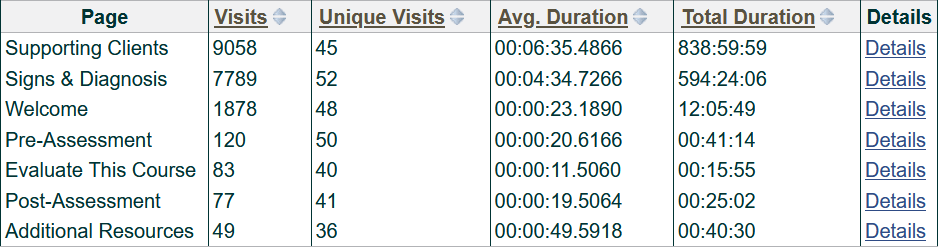
Participants in your course need to be spending enough time in the lessons to benefit. If you look at the total time they’ve spent in lessons, you can get a great overview. The example above shows how long people are spending on each page and how many times each page has been accessed. The result is that you can assess how invested they are in the online course or if interest is lagging.
Online Assessments
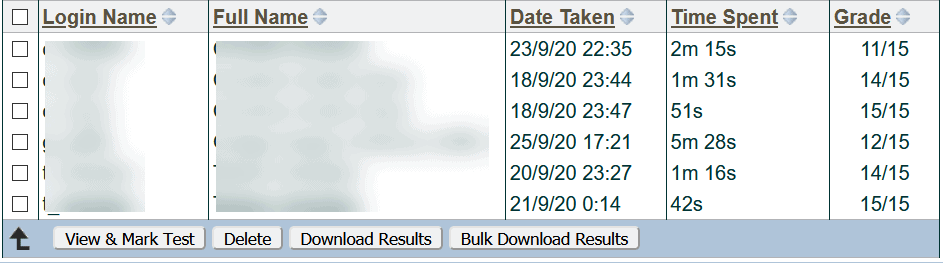
Online assessments are one of the best gauges of how much progress your participants are making and how well they’re performing. It’s best if you can issue a pre-course assessment and a post-course assessment so you can see each person’s improvement (see Knowledge-gain below).
Assessments individually or collectively can also tell you if the information you’re delivering is being received the way you want it to.
Knowledge-gain
Many would argue that this is the main training metric you need to track in order to report the success of your program. Some of the best indicators for knowledge gain are pre-course assessments, post-course assessments, and self-assessments, which should all align with the learning objectives you developed in advance. Ask participants the same questions before the training as after, and you’ll be able to see an increase or plateau of knowledge. If the increase isn’t significant enough, it’s time to change something.
Knowledge-gain is an improvement percentage that is the ratio of positive change. How to Calculate Improvement Percentage from Sciencing has a helpful how-to.
Certificates Earned
Certificates are a powerful motivator for many employees, and they’re required for many healthcare training courses. Checking your LMS reports for how many certificates were earned—and by whom—can help you make sure you’re reaching your objectives.
Satisfaction

With the work it takes to implement a training program, it can be difficult to find time and resources to evaluate its effectiveness. By ignoring how well (or poorly) your training program is engaging participants and making a difference in their work, you could be wasting time and money.
A learner satisfaction survey, even a simple one, can help you gather data on how much your participants value the training. Higher satisfaction equals higher engagement and success overall.
Some basic satisfaction questions you can add to your evaluations are:
- The facilitator answered all my questions.
- How would you rate your experience in this course?
- Which parts of the training are most useful in your job?
Make sure these training metrics are included in your regular monitoring. Bonus if you can schedule them to be delivered the week before you’re due to submit your grant report. Even if you don’t have a grant reporting requirement, still fold in these best practices so you know how your training is performing and make timely adjustments as needed.